
Bike Share Fireworks
Published:


What does one of the world’s most famous bikeshares look like, on one of its city’s most famous holidays? In this project, I track use of the Paris Vélib’ system from 13:00 on Bastille day (July 14, 2023) through to 13:00 the next day. And I thought I would stylize that day’s Vélib usage to look like fireworks – a reminder of how lively, communal and exciting bikeshares can be when they are popular. Some key findings from this project:
- the city centre dominates overall in terms of usage, but the area around the Eiffel Tower saw high usage following the fireworks
- the system saw at least 187,000 docking movements, or the equivalent of at least around 95,000 trips, over the 24 hours. At peak times, some stations saw around 1 dock movement/minute.
- most stations (1190, 84% of total) had the equivalent of their entire capacity organically replaced over the day, rising to more than 5 full replacements for 61 stations .
- areas around bike lanes, notably the rue de Rivoli and Boulevard Sébastopol saw significant usage, underlying the importance of smart infrastructure development to encourage usage.
Bike shares, sustainability, Vélib’
Shifting to more sustainable societies will require more environmentally-friendly ways of getting around. Bike share systems constitute a collective, active and gentle transportation option to get around cities.
In 2007, the Paris Mayor’s Office paired the public tender of its advertising display market with a bikeshare market, leading to the launch of Vélib’ that year.
- The bikeshare service now has 1400 docking points in the Greater Paris area, and over 20,000 bicycles (40% of which are electric). In 2020, it had over 400,000 subscribers (see more information here).
- Alongside efforts by the Paris Mayor’s Office to expand bike lanes and bike ownership (more information here, it has contributed to a boom in bike ridership in the French capital.
- Bike ridership has increased by more than 5 times over two decades.
As mentioned, in this project, I tracked usage of the Paris Vélib’ system from 13:00 EST on Bastille day through to 13:00 EST the next day. To do so, I leveraged the excellent open data system that the Paris Mayor’s Office has put in place, to gather updates on each station in the network, once a minute – or around 2 million data points total. More information about methods, as well as a savable, sortable and searchable table of all cumulative station data is to be found at the bottom of this post.
Midnight biking
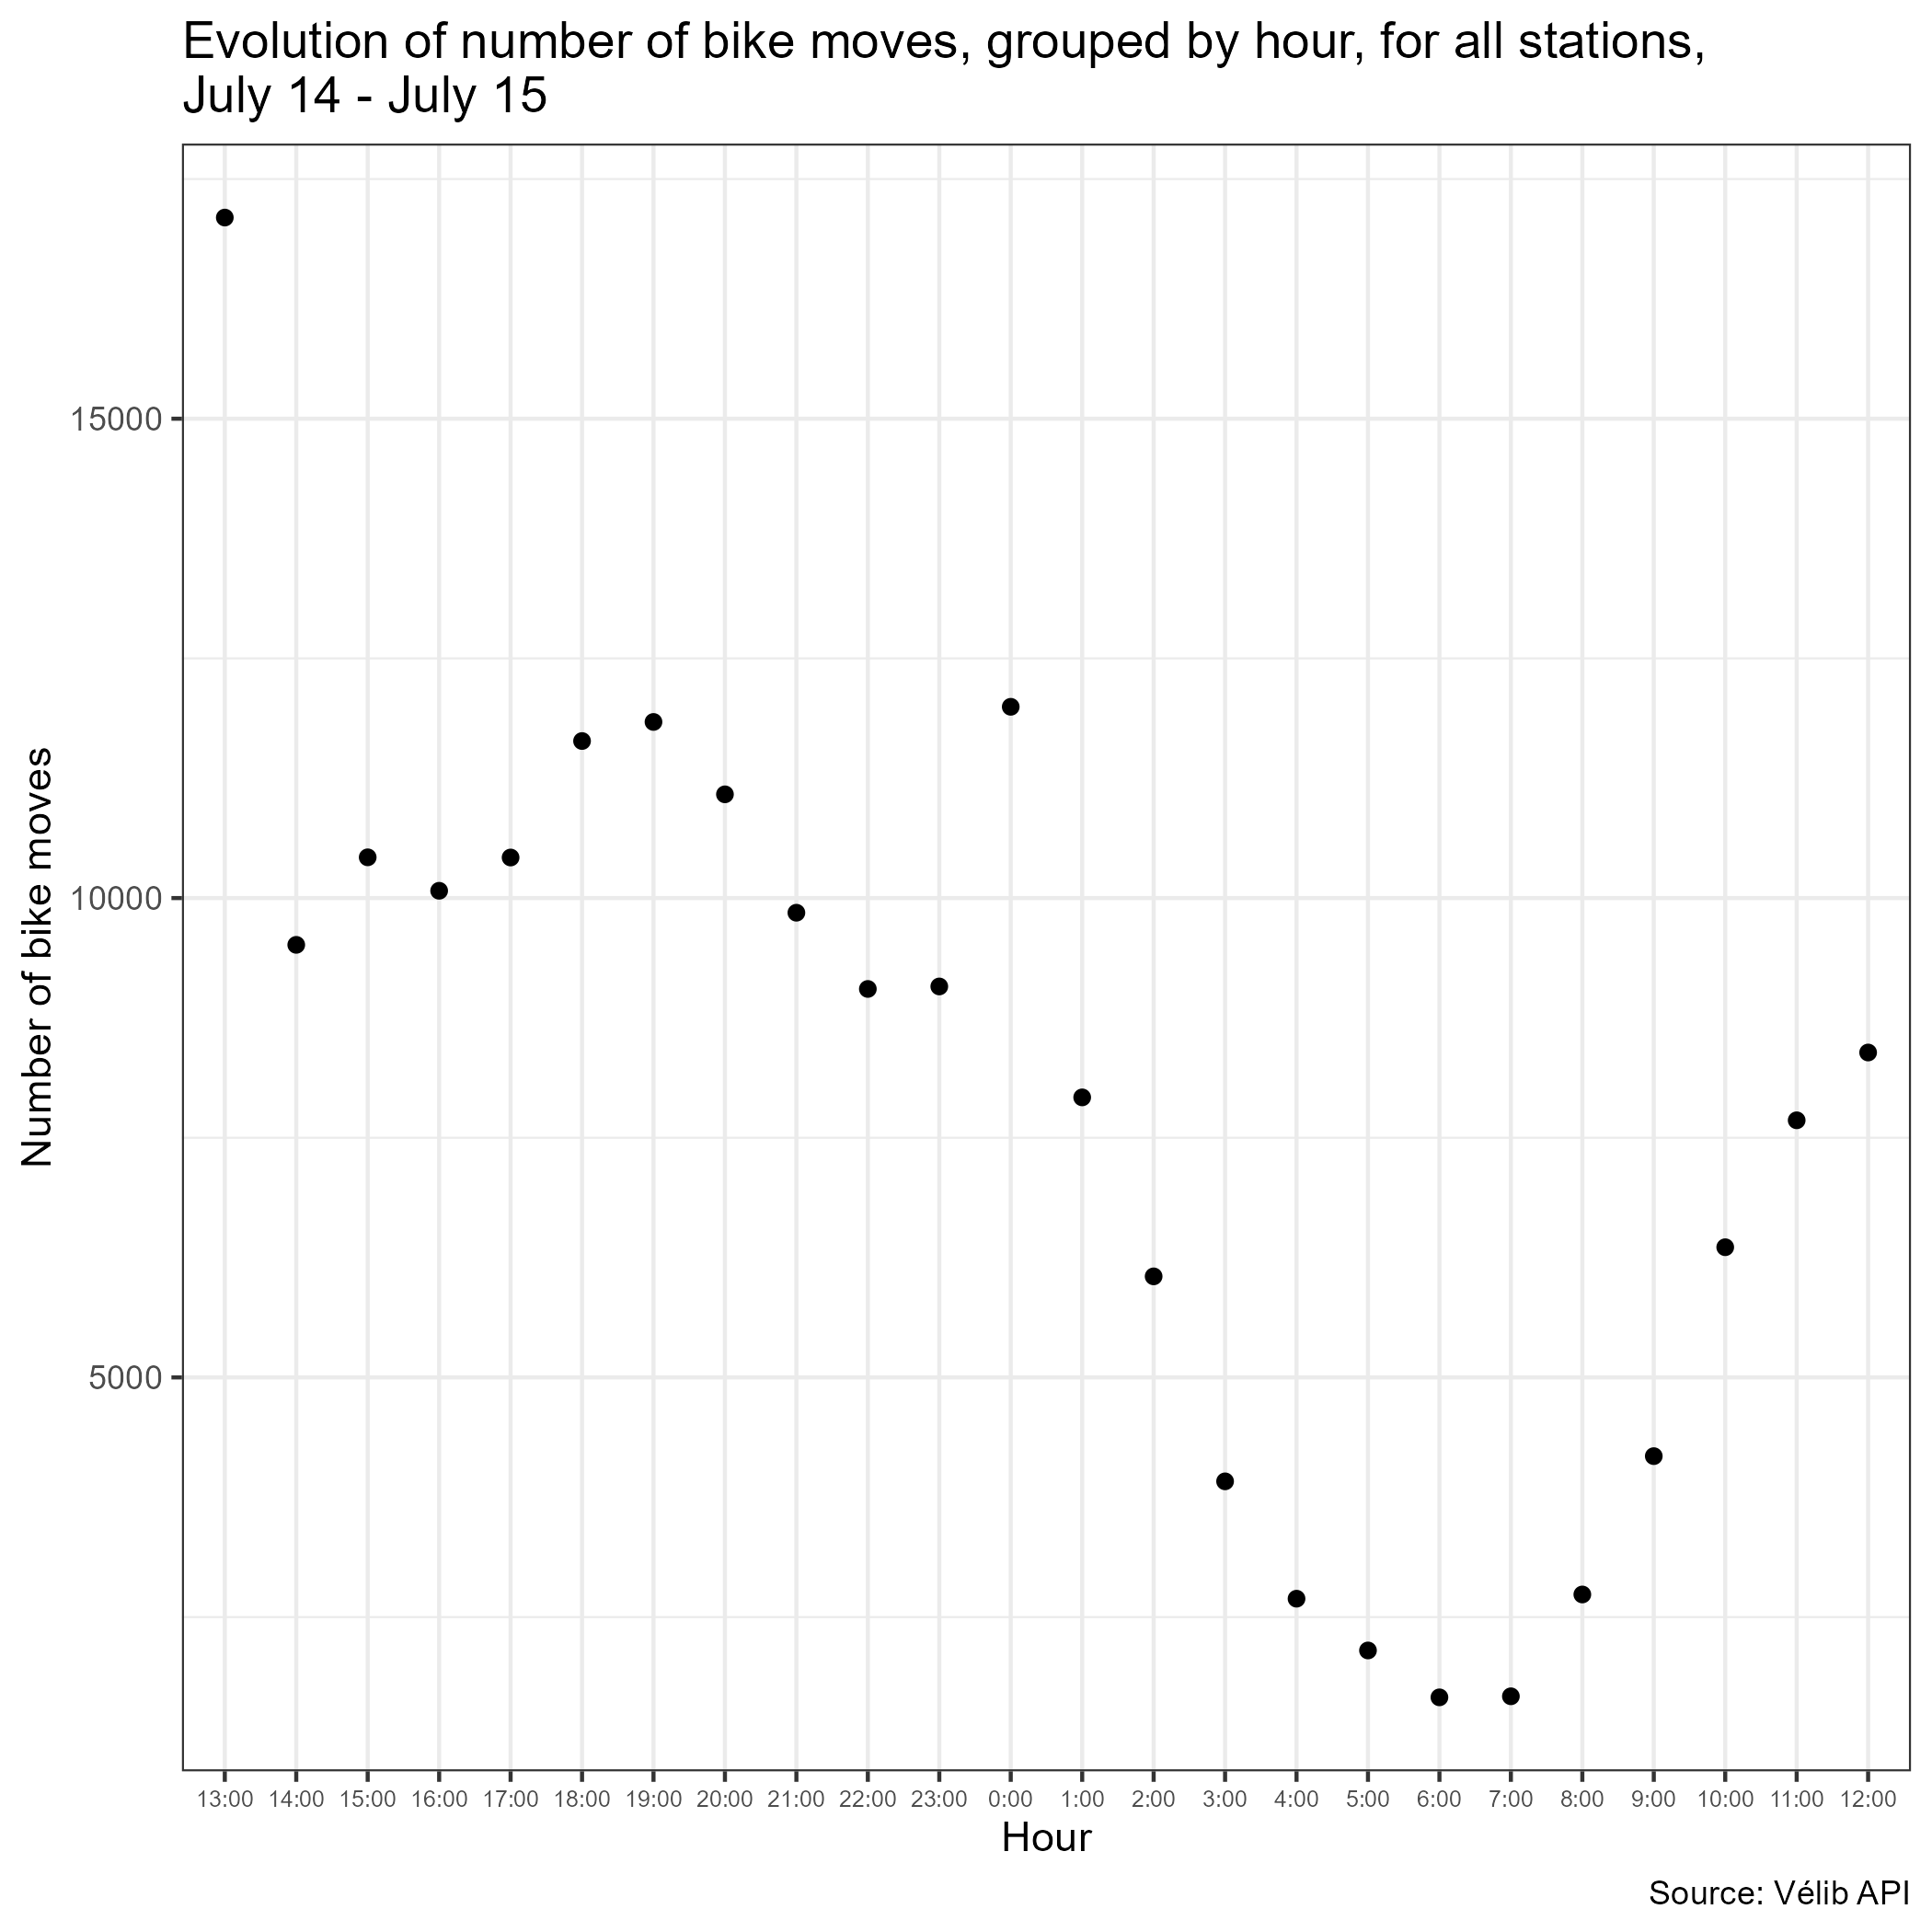
Looking at all the bike moves across the entire network, there is a perhaps unsurprisingly circadian rhythm to the use of the bikeshare system, rising during the day, and falling at night. Some elements stand out – the 13:00-14:00 hour on the 14th, as Paris resumed life following the parade, and 00:00-01:00 on the 15th, the hour that includes and follows the fireworks.
A lot of variation in station use
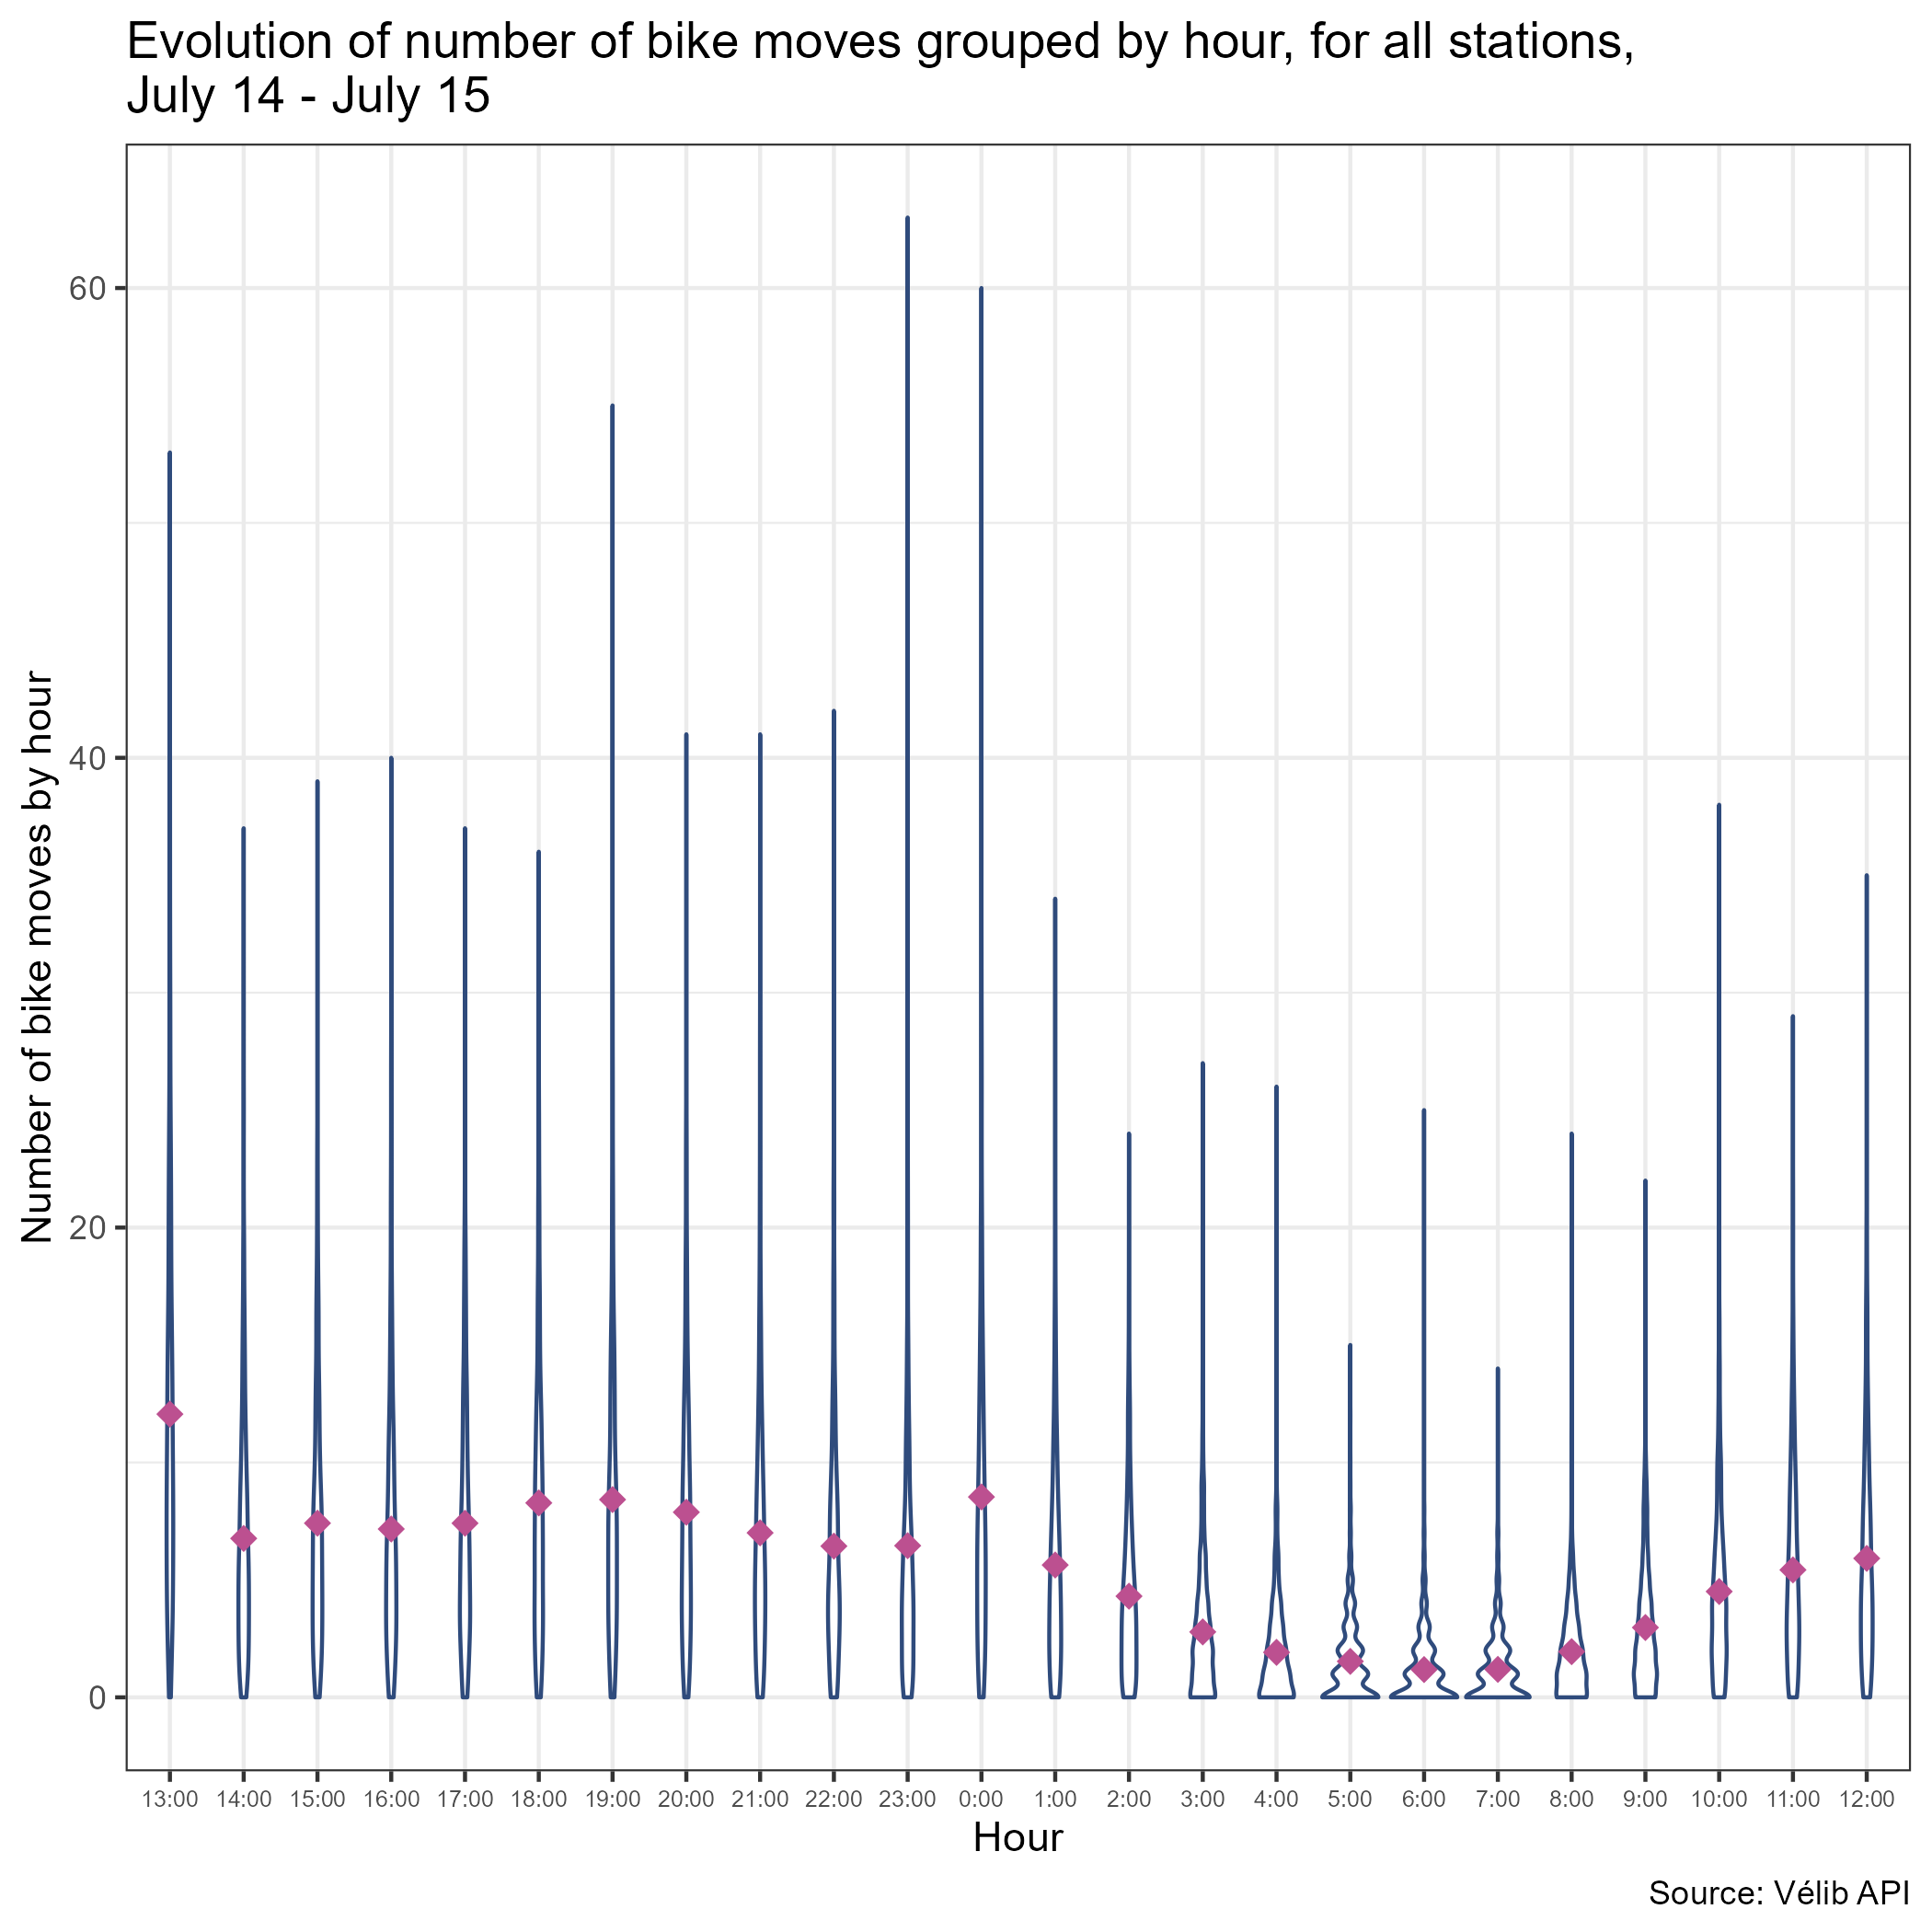
This same pattern is also borne out when looking at the distribution of bike moves at each individual station, for each hour, though these violin plots’ very elongated shapes highlight the high level of variation in station use. Some stations saw over 60 bike moves per hour, or more than one/minute!
Hot spots
Usage by station can also be mapped, here using the open-source Stamen Design maps, which build on OpenStreetMap data. I combine data on the number of bikes taken out from the station over 24 hours (usage), with an indicator of strain, which corresponds to usage as a percentage of station capacity. Station capacity ranges from around 10 bikes, to 74 at the largest location at Emeriau-Beaugrenelle. 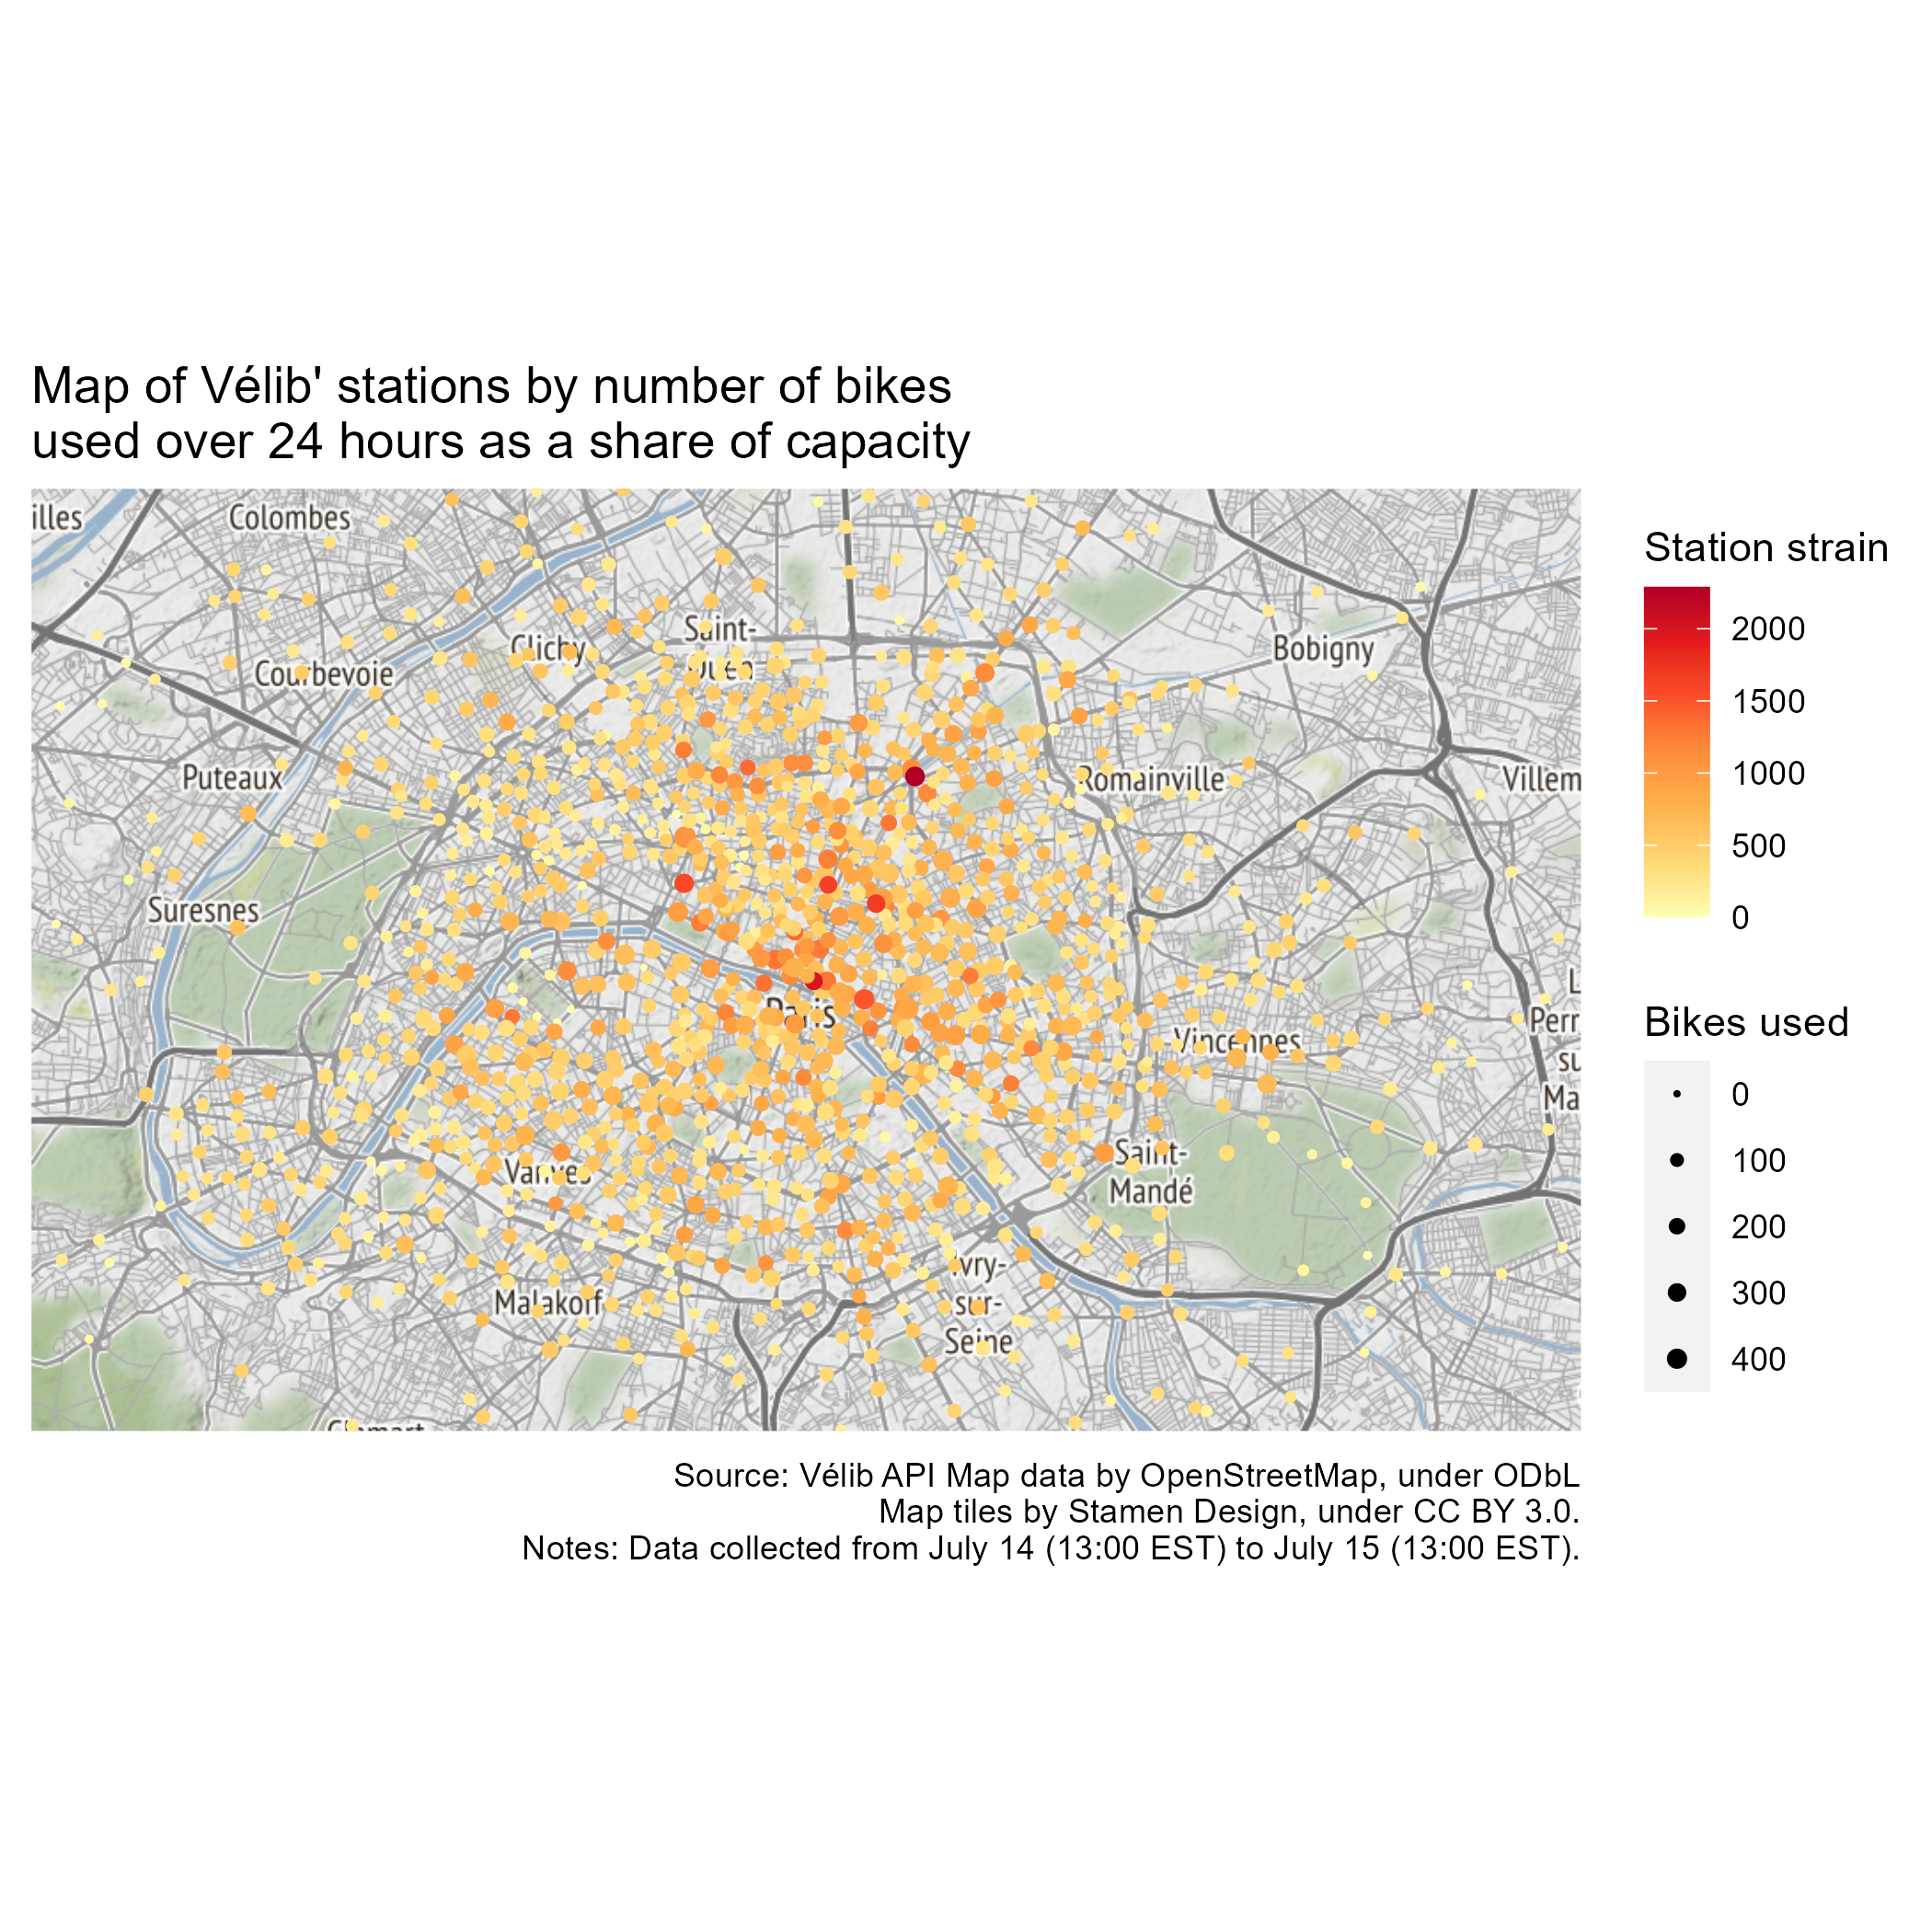 Some observations based on that map:
- The centre of Paris (unsurprisingly) gets most of the attention. People are coming in to the centre, or switching modes at the centre.
- Some of the big axes of the Paris bike network are visible, notably the East-West Rue de Rivoli, and the North-South Boulevard Sébastopol. Based on data from Paris’ bike counters, both streets see the highest numbers of Parisian cyclists a day – more than 200/hour for parts of Rivoli, and 300/hour for parts of Sébastopol. Train stations, notably the Gare de Lyon, are also prominent on the map.
- Relatedly, the area to the West of Paris near the Bois de Boulogne, the 16th arrondissement, sees relatively little usage, in line with its reputation as the worst district for cyclists in Paris.
- The five most popular stations by use were Gare Saint-Lazare - Cour du Havre (499 movements), Richard Lenoir - Place de la Bastille (464), Gare de Lyon - Place Louis Armand (456), Constantine - Université (410), and Saint-Antoine Sévigné (399).
- The five stations with the most overall strain were Quai de la Loire - Jean Jaurès (2288%), Place de l’Hôtel de Ville (1993%), Place de la République - Temple (1683%), Strasbourg - Saint-Denis (1644%), and Godot de Mauroy - Madeleine (1582%).
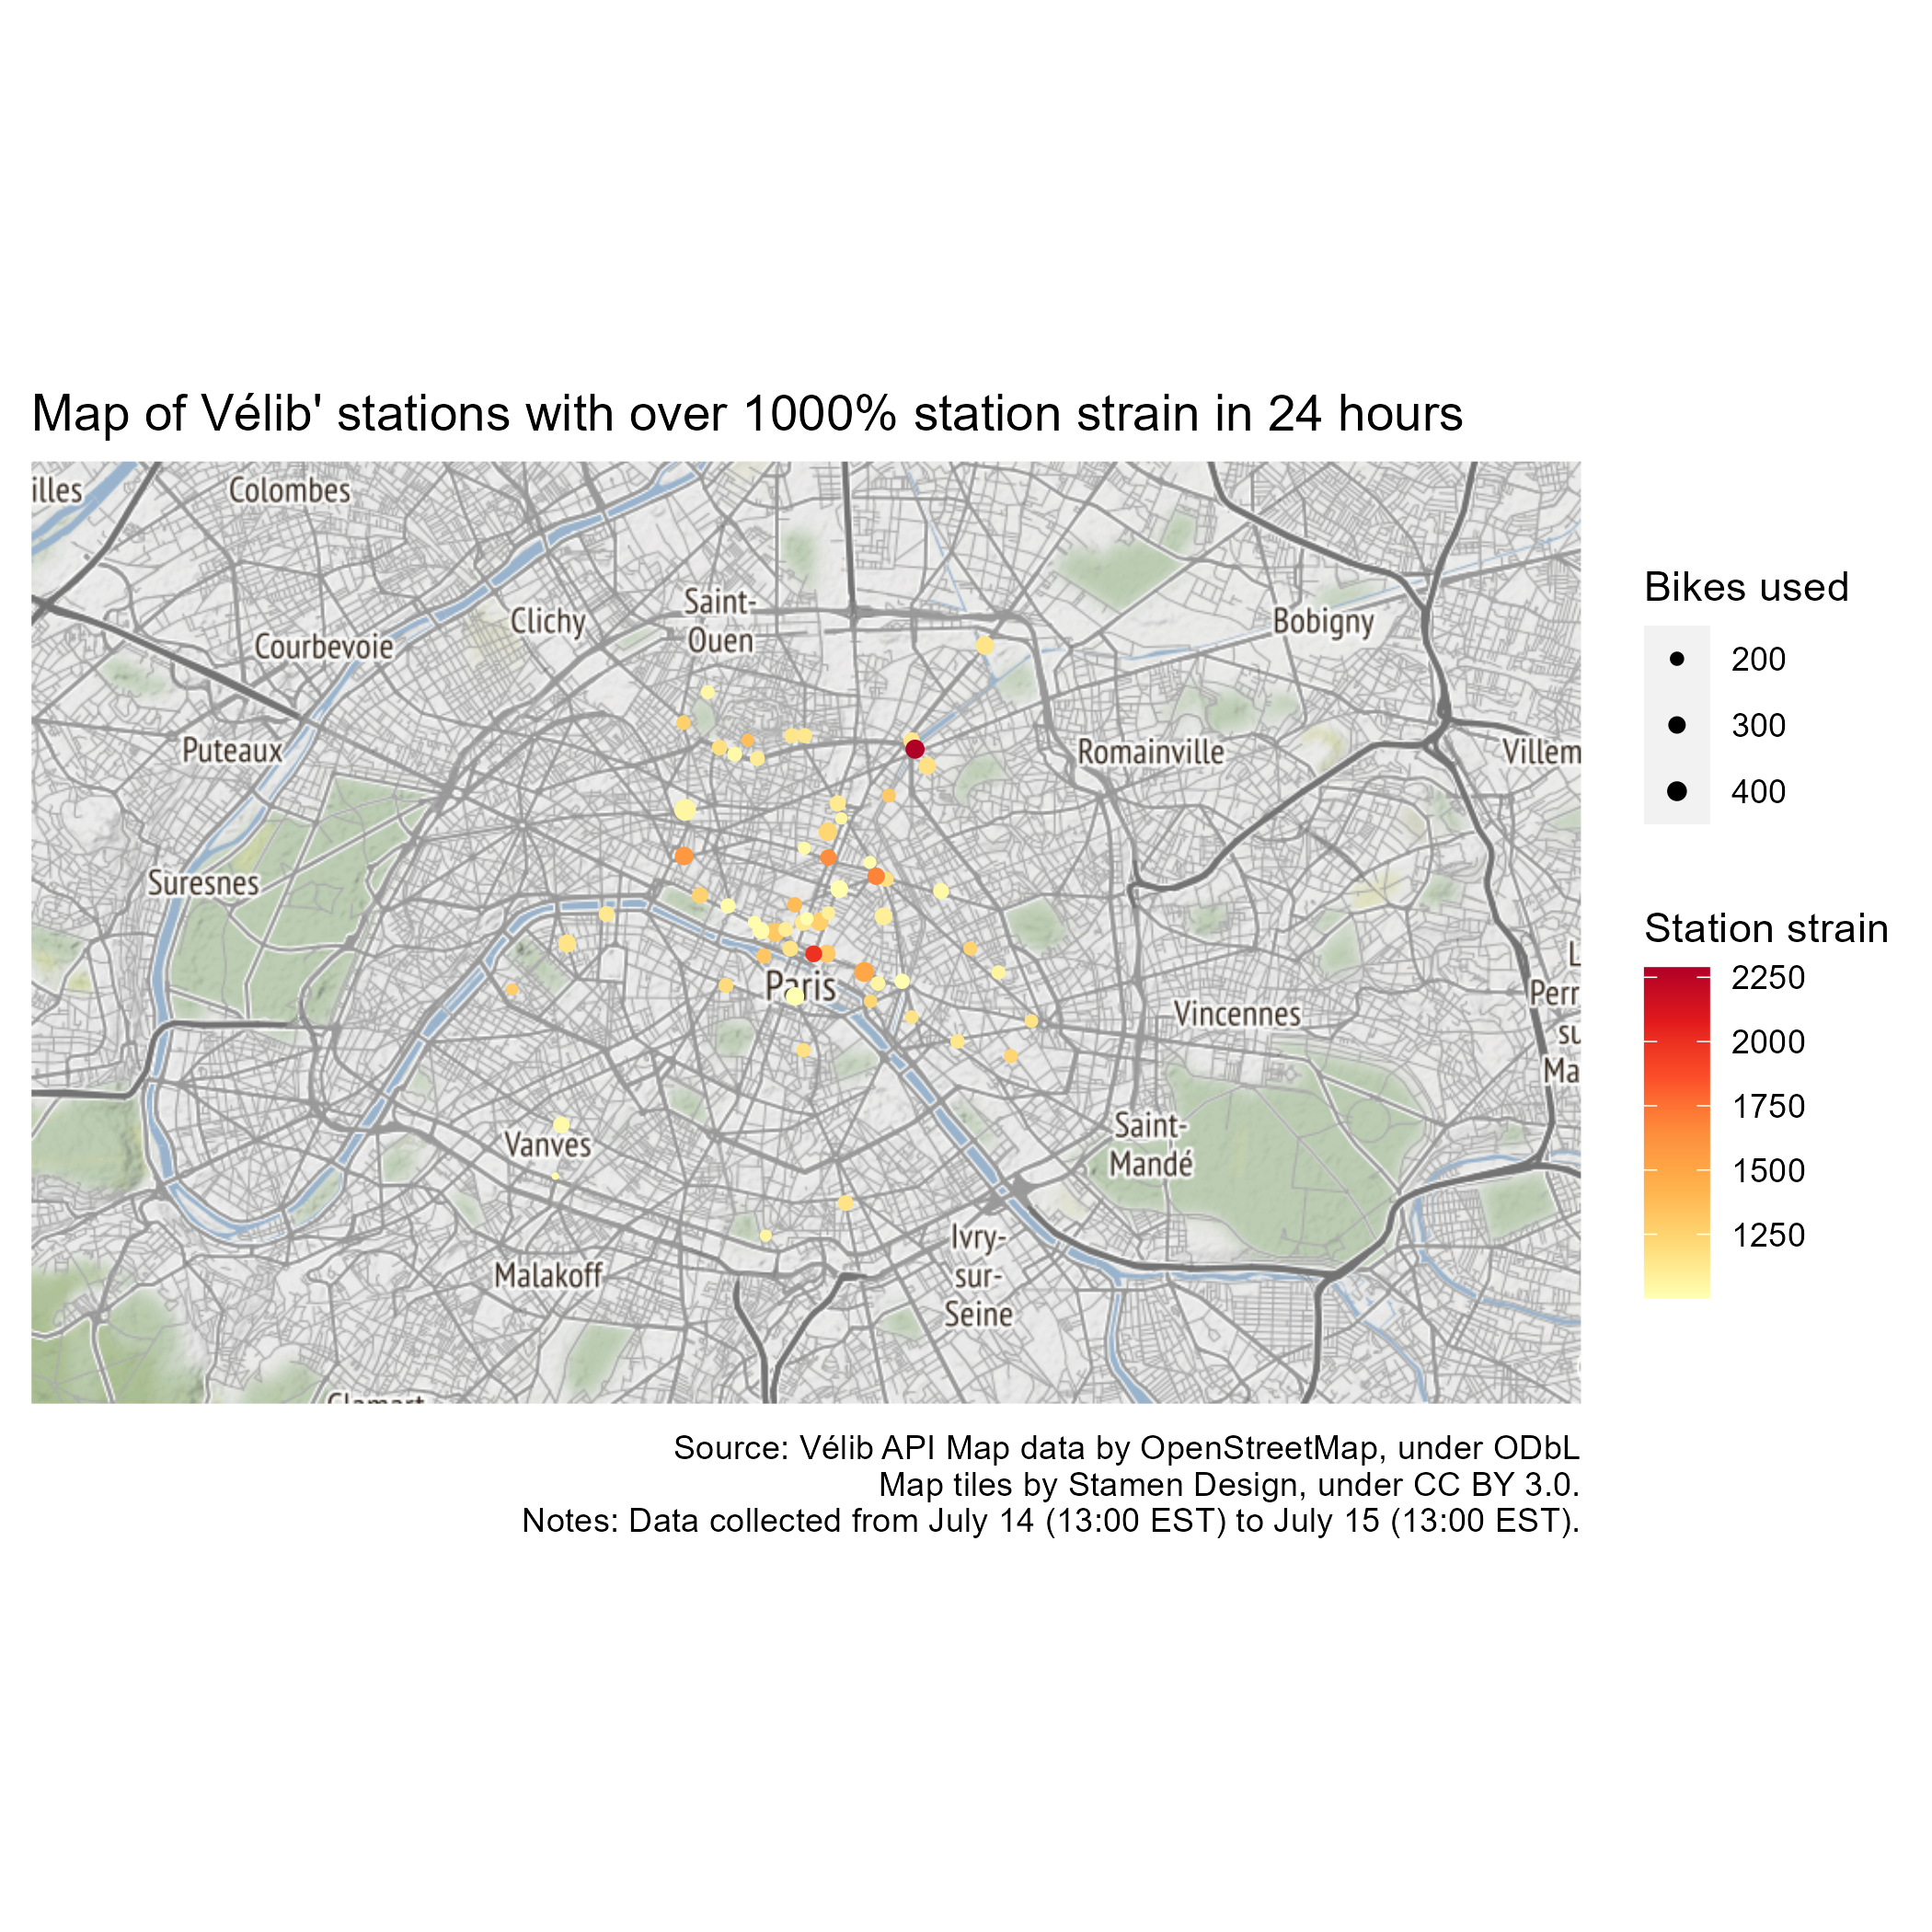
- 1190 stations had at least 200% strain over the 24 hours, and therefore had a theoretical complete and organic renewal of their bike stock, representing some 84% of the operational stations. 61 stations had over 1000% strain in 24 hours, and therefore had the equivalent of their entire bike stock replaced at least 5 times (see below), concentrated in the high popularity areas.
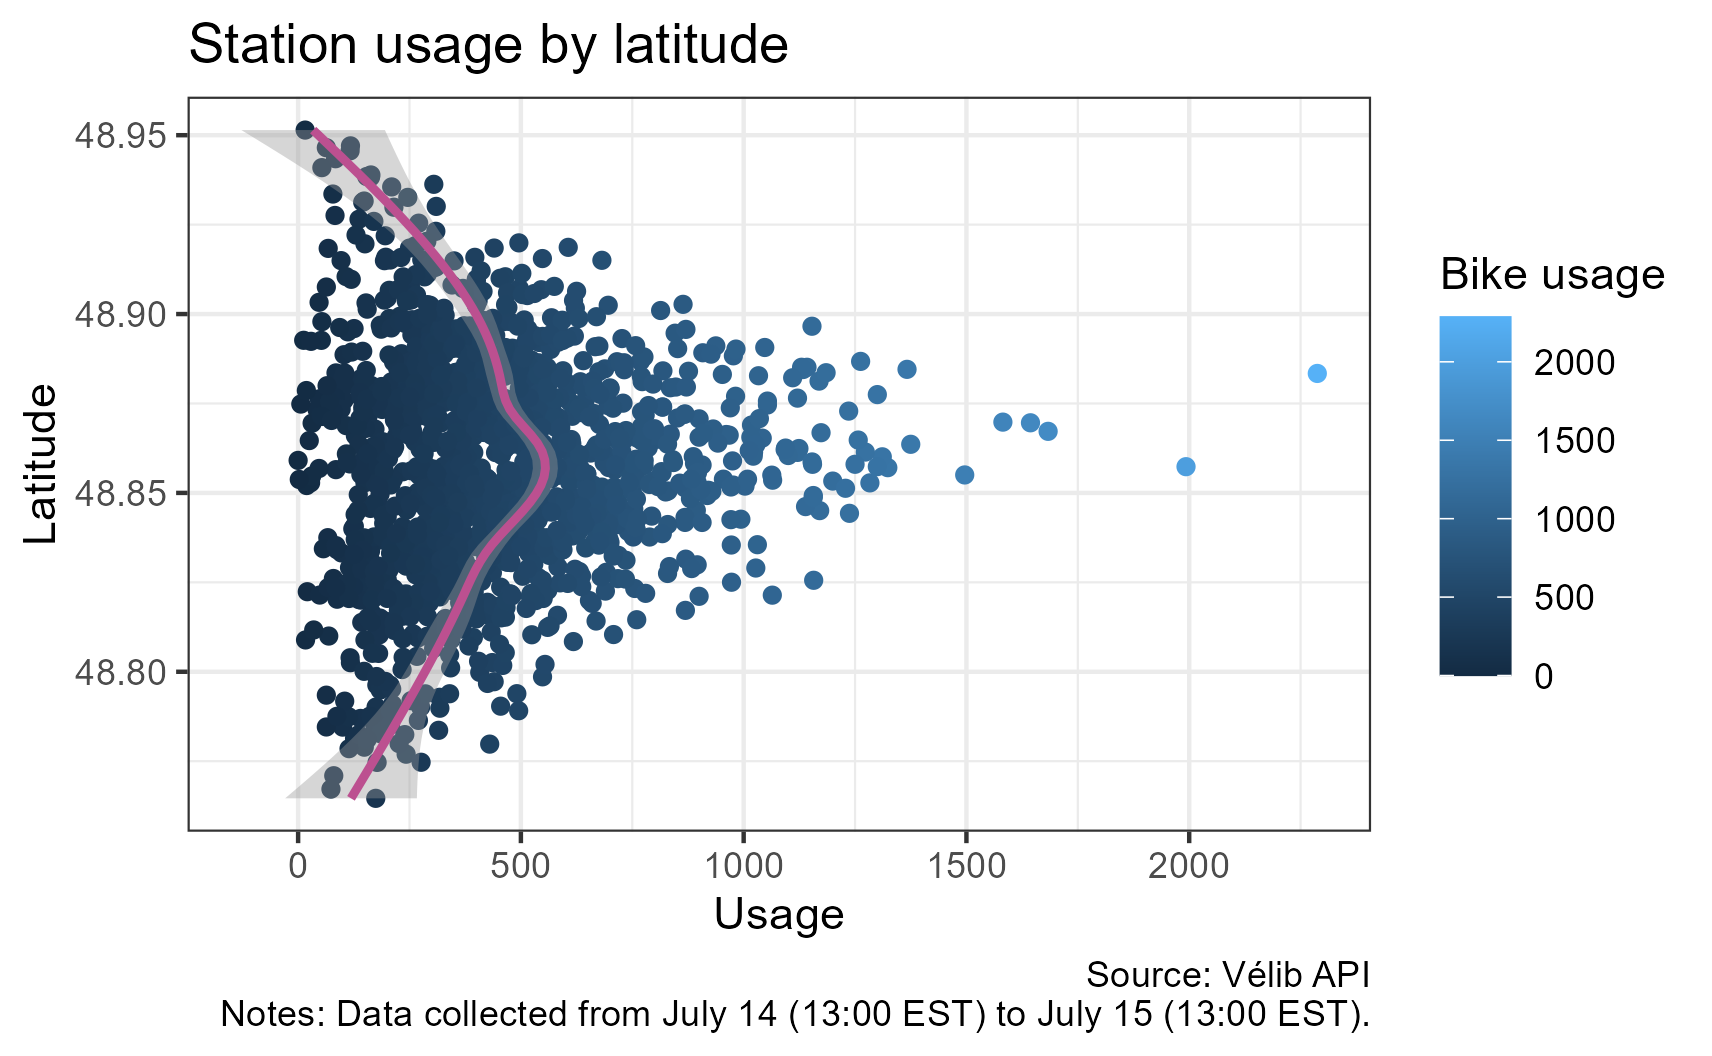
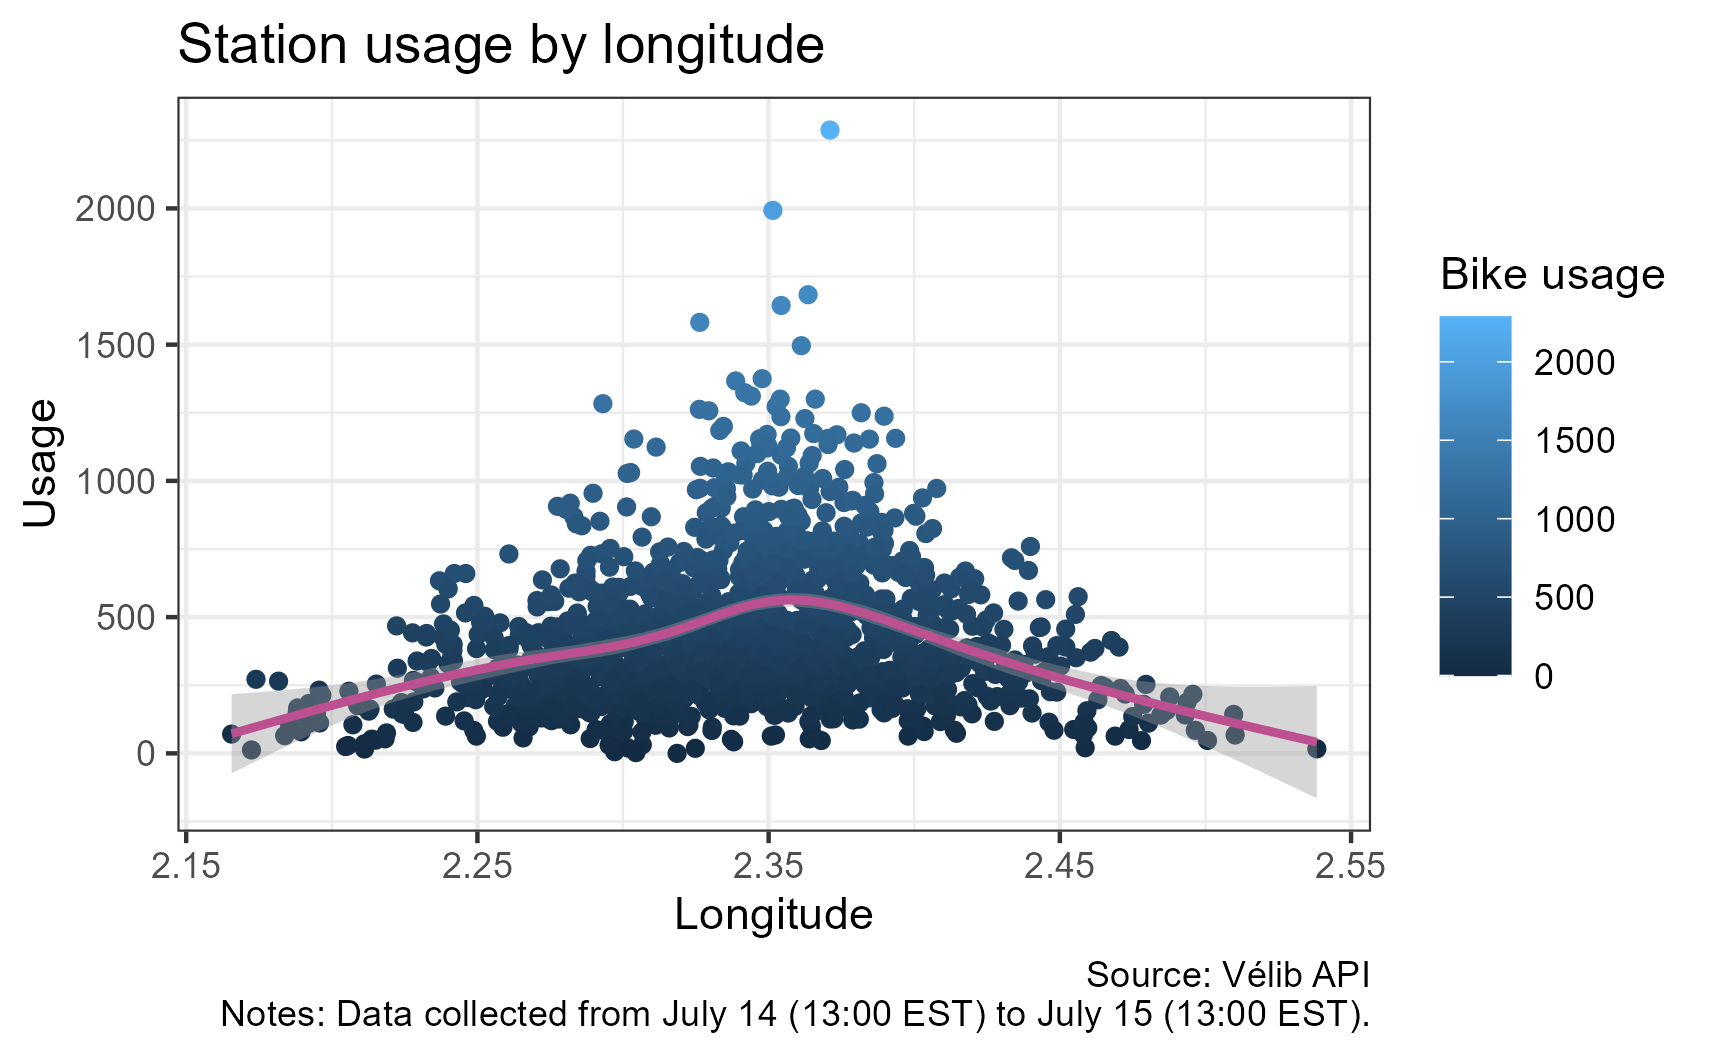
Centre usage dominates
The distribution of stations in Paris is not uniform, with the suburbs having many fewer stations. Looking at the stations’ usage by longitude and latitude, we can see that while some downtown stations have lower usage than the more ex-centric stations, on average, usage is higher centrally.
Closing thoughts: Fireworks to celebrate the system
Usage also varies over time. And indeed, zooming in on Bastille Day itself, we can see that the area around the Eiffel Tower, in the Southwest corner, does see a lot of bike usage and strain around the time of the fireworks (22:00 on the 14th through 01:00 on the 15th).  Indeed, around half of the top 10 stations in terms of usage between 22:00 and 01:00 were in close proximity to the Eiffel Tower, Trocadéro and Champs de Mars. For example, Emeriau - Beaugrenelle (the largest station in the network!) as well as Dupleix - du Guesclin, Suffren - La Motte-Piquet, Cambronne - Villa Croix Nivert or Surcouf – Université, were some of the most used stations in the network over the 22:00-1:00 period, and all saw movements between 1x and 2x their full capacity (100%-200% strain) over just those three hours.
Looking at Vélib’ highlights how popular it is, and how far the city has already come in building up bikes as a viable means of transportation. As the network continues to expand, it could strive to fill some of the gaps in the suburbs, and to relieve strain on some of its most popular stations. I stylised those previous two figures a bit, getting rid of the map and legend, and expanding the area considered to make them look more like fireworks, with all the energy and excitement that entails.
Bonne fête nationale à tous·tes!
A brief note about methods and the data
I collected this data by querying the API in real time, every minute over 24 hours. The API returned a status for every station in the system – combining the with information for the previous minute, I could get a sense of how many bikes were moving in the system. This is therefore likely an undercount. While some bike changes may correspond not to use but to signaling due to malfunction (which would lead to an overcount), more likely will not be counted since, especially at popular stations, it is possible that someone would take out a bike while someone returns a bike in the same minute (leading to an undercount). The data was stored in an SQL database. Feel free to contact me for more information about the methods or for the code used.
The Paris Mayor’s Office open data website, “Paris Data” is an excellent resource for a wide range of data about the city’s functioning.
Stamen Design maps were used for the maps of Paris, using their “terrain” option. They provide these open-source maps on top of the open-source OpenStreetMap data.
Color choices in charts benefit from Kennedy Design’s color picker.
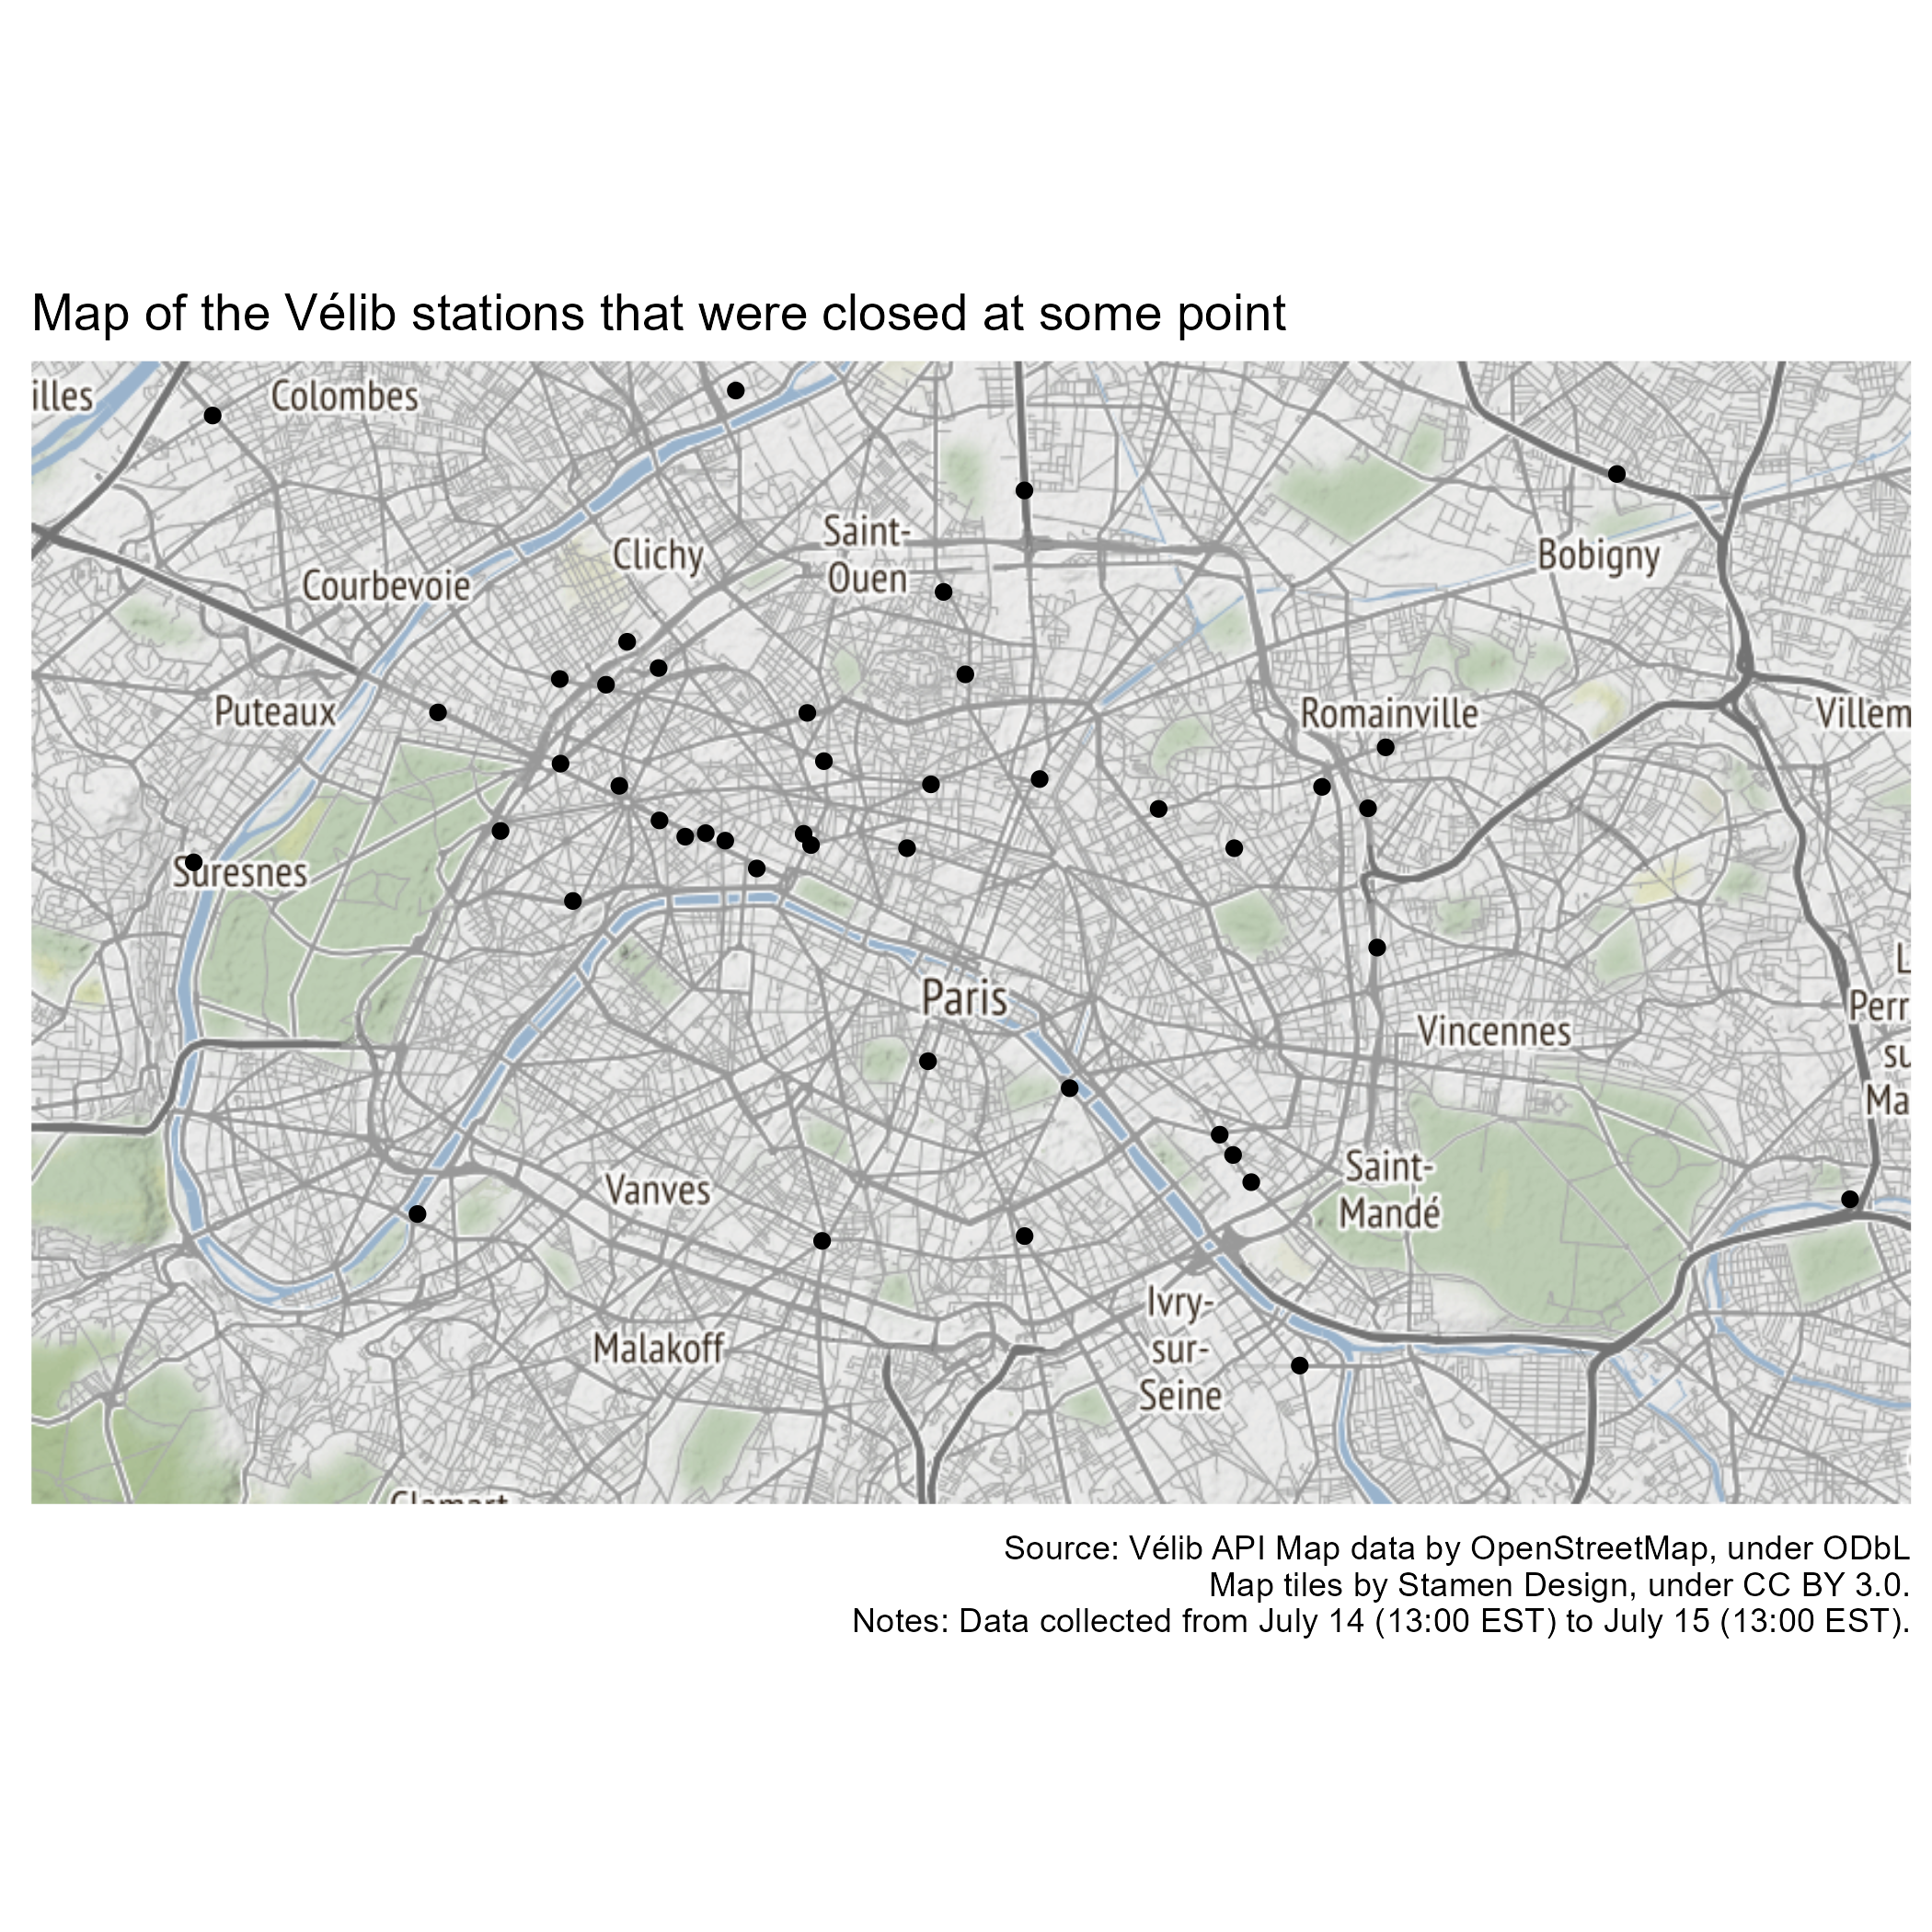
Station closures
It is also worth mentioning that some stations were closed for all or some part of the festivities, as visible below. In particular, it is clear that some stations were closed near the Bastille day festivities, including the parade on the Champs-Elysees, and viewing of the fireworks at Trocadéro.
Sortable table of cumulative data
This table provides the cumulative data over 24 hours, and is available for download. You can also use the buttons to sort the data, or the search bar to find the stats for a specific bike station.