
Climate Change in the New York Times
Published:
Media attention has a significant impact on the politics of climate change (see Maxwell Boykoff’s work, for example). Coverage has an impact on public opinion, as well as on how policy questions are debated or framed. In this post, I use the New York Times’ API to assess how the newspaper has covered climate change over the past few decades.
The dataset for the analysis is the subset of NYT articles from 1995-2022 that included climate change terms in their abstract (typically a paragraph of text provided by the API about the article).
I look at:
- the frequency of climate change articles over time, by desk and by published page to get a sense of how the salience of climate change coverage has evolved over time
- word use in the abstracts
- climate change and natural disasters
For more detail about the code used to compile the dataset, take a look at my github page.
A larger share of articles, with a new desk, and more front pages
This section highlights the increasing coverage dedicated to climate change over the period through various indicators.
Frequency overall, over time
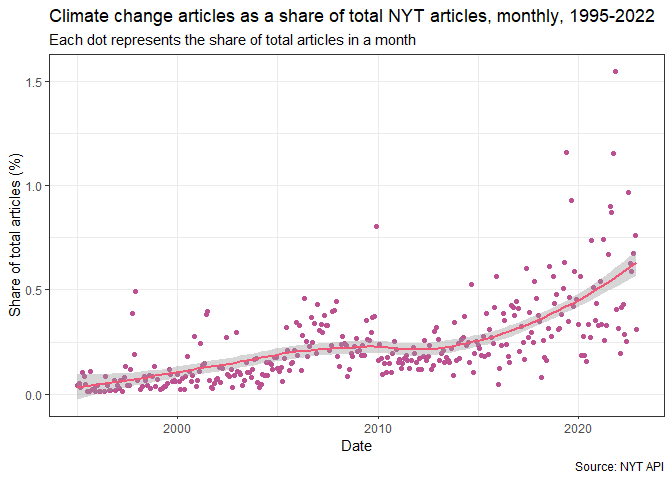
As a share of all articles published each month, climate change articles have become a larger share in recent years. As will be visible in future charts, the 2005-2010 saw an increase in coverage before stagnation in the early 2010s. It’s only since 2015 that the share of articles discussing climate change has regularly been above the 0.5% threshold.
In the chart above, it’s also clear that there seems to be some kind of seasonal pattern to the publishing.
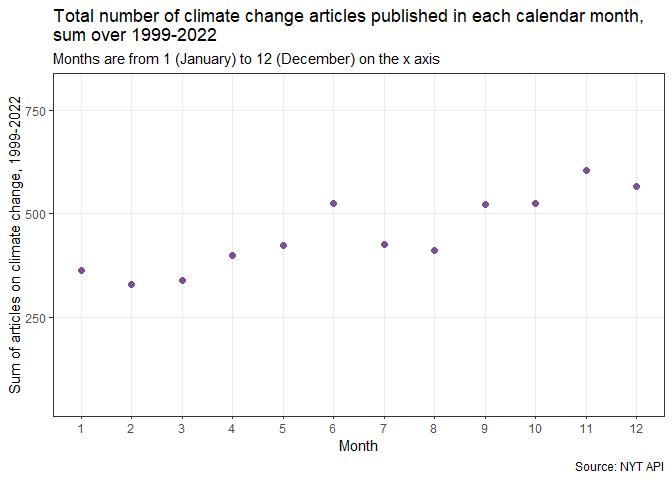
These charts suggest that generally there tend to be more articles published toward the end of the year, and in June.
Frequency by desk
In the next section, I look to see how coverage has shifted between desks.
The following table highlights the variation in aggregated NYT desks (I aggregated desk codes that likely reflect historical shifts in naming (e.g. Business vs. Business Desk), and put all desks with fewer than 100 articles into their own “other” category). The National, Foreign and Editorial desks have a significant share of articles, reflecting their historic dominance and significant size. A significant number are either unclassified or in smaller desks.
##
##     Books  Business   Climate   Culture Editorial   Foreign   Letters    Metro.
##       111       406       449       136       571       585       107       243
##  National      None      OpEd     Other   Science
##       584       867       394       694       293
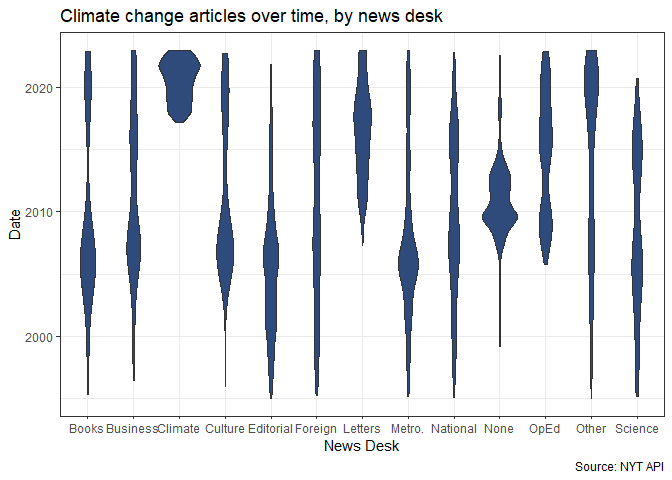
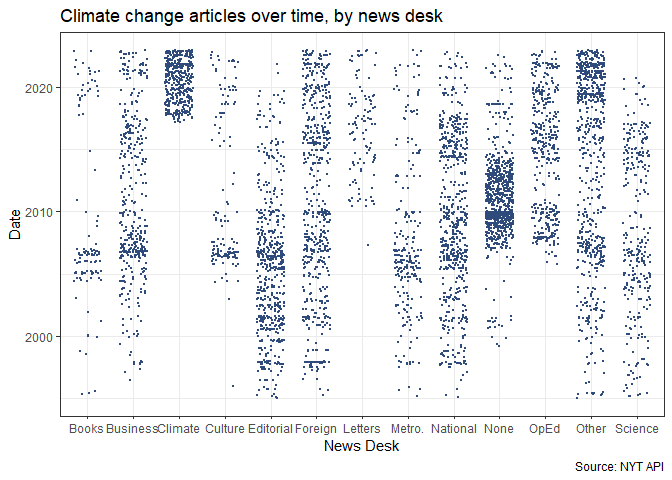
From these charts, some notes:
- The charts highlights the creation of the new climate desk at the NYT in 2017, with about 450 articles written by that desk since, nearly 10% of the total number of articles in our sample.
It also highlights the seeming creation of new tags for letters and op-eds mid-way through the sample.
Beyond that, looking at the data, there’s a concentration of articles in the book section around 2005-2007 (the era of Al Gore’s An Inconvenient Truth), and over the past three years. There are a perhaps surprisingly large (and continuous) number of articles from the Business desk, also peaking around 2006-2007.
- Looking at the different geographic desks, it is striking that the flow is more or less constant for the Foreign desk, has larger peaks in 2009 and 2016 for the National desk, and is definitely focused around 2006 for the Metropolitan desk.
Frequency by Page Number
Next, I turn to the page numbers – which gives a sense to the relative importance accorded to climate change as a topic on any single day.
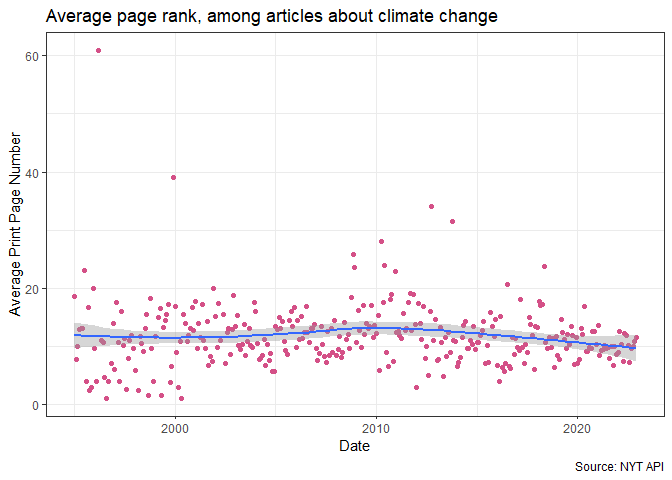
There generally seems to be a relatively constant page rank for articles about climate change – but it seems likely that earlier years are influenced by having relatively few articles. There does seem to be a downward trend “towards the front” in the past decade.
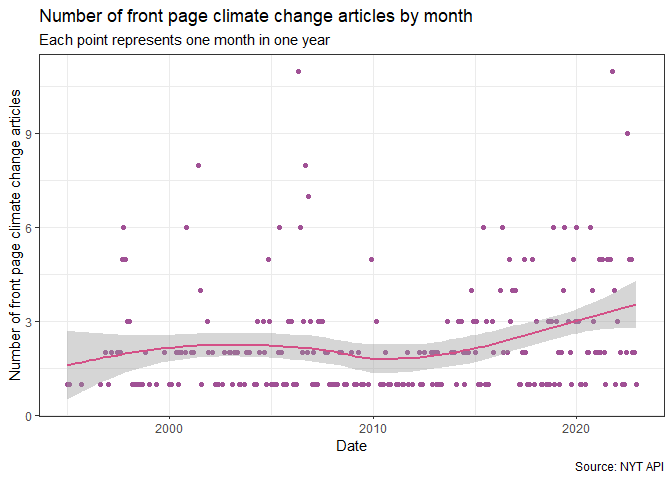
One way around the issues with the previous chart is to just focus on front page stories (aka print page 1). Indeed, over the past five years, there has been an increase in the number of more front page stories about climate change. The peaks of front page coverage were in May 2006 (an Inconvenient Truth was released on May 24) and October of 2021.
Vocabulary of NYT climate change coverage: Presidents and Scientists, Nation and World
Quanteda tools allow for a deeper dig into the vocabulary used in the abstracts.
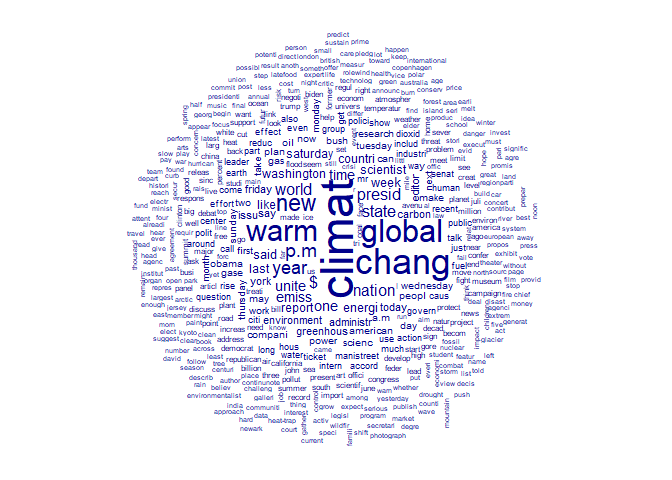
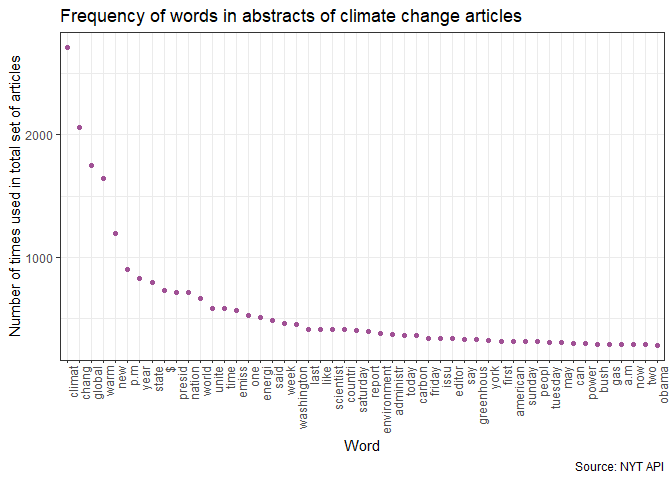
These exercises to determine the frequency of stemmed words used in articles reveal some key insights. For one thing, political leaders stand out – “Presid”, but also specifically Bush and Obama. Other actors that are key to these debates, and to press discussion, are scientists, mentioned nearly 500 times. Perhaps ironically in the context of global collective action debates, “nation” and “world” are #11 and #12 in frequency, respectively. As a last note – it is perhaps not surprising to see how much money (“$”) gets mentioned in these articles.
Natural disasters
Coverage of disasters and climate change in NYT increasingly linked
Finally, the rest of this project will be focused on looking at how natural disasters drive coverage of climate policy, using a dictionary for natural disasters to sort through our existing corpus of articles.
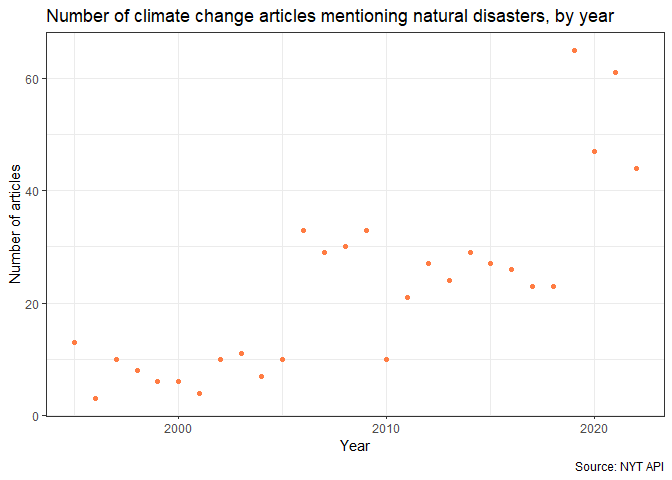
Indeed, while the number of climate change articles has been increasing generally, it is also seems like there are more articles specifically referencing natural disasters as part of the coverage (though this could just be a reflection of a higher frequency of natural disasters, as well).
Estimates of impact of natural disasters covered in NYT articles about climate change
For this next and final section, I go to Wikipedia to gather some data on the impact of these natural disasters that are mentioned in articles referencing climate change. I manually skimmed the selected abstracts for references, and then found the relevant Wikipedia page url. There are not English Wikipedia pages for all disasters.
As discussed, the NYT is increasingly touching upon specific natural disasters in its climate change coverage. Many of the disasters mentioned were devastating in terms of human and economic costs.
It’s worth noting that most of this coverage remains of US and Western European disasters – despite our understanding that these places will not necessarily face the biggest challenges. And indeed, looking at word counts, it is striking that articles above 1,000 words are focused on natural disasters in the West.
Closing thoughts
This analysis of the “newspaper of record” highlights how coverage of climate change has evolved over the past few decades.
- The share of climate change articles as a share of all NYT articles has been multiplied by 10, with a particular increase surrounding the release of Al Gore’s An Inconvenient Truth, underlining the movie’s impact on discussion of climate change. A similar trend can be observed in terms of front page articles.
- Desks such as Business and Foreign contribute a significant number of articles on climate change, highlighting the range of perspectives covering the issue.
- Key actors and dynamics emerge from word use analysis – coverage emphasizes presidents and scientists, financial considerations, and both “nation” and “world.”
- Discussion of climate change seems to increasingly be included in articles about natural disasters (and vice versa), in line with our growing understanding of how climate change is fuelling more intense and frequent natural disasters.
Sources and Notes
The NYT API is an excellent resource for textual analysis of its coverage.
The analysis was conducted in R, in particular drawing from the Quanteda package for text analysis.
Color choices benefit from Kennedy Design’s color picker.
The climate change terms used in the initial analysis are: “climate change” “global warming” “greenhouse effect” “climate catastrophe” “climate emergency” “climate crisis” and “global heating.” To select these terms, I drew from established work (see for example Lineman et al, or Kumar and Li).